
- Total Divorces: 47,216 – a 3% drop from 2023. (Apparently, fewer couples felt like filing paperwork this year.)
- Crude Divorce Rate:2.1 divorces per 1,000 people aged 16+, one of the lowest since the Family Law Act 1975 shook things up.
- Median Marriage Duration: Now 13.2 years before calling it quits – proof that Australians are really pushing through that “for better or… okay, never mind” phase.
- Median Age at Divorce:
- Men: 47.1
- Women: 44.1
- Longer-Term Marriages: More couples married 20+ years are deciding they’ve had enough. Better late than never?
- The “Percentage” Myth: People love to say “30% of marriages end in divorce,” but that’s a lifetime estimate – not a prediction for your marriage. Comparing one year’s divorces with that same year’s marriages (which gave ~39% in 2024) is statistically cute but completely misleading.
What Percentage of Australia Marriages End in Divorce?
| Metric | Value (2024) | Notes |
|---|---|---|
| Number of Divorces Granted | 47,216 | A 3.0% decrease compared to the previous year (2023). |
| Crude Divorce Rate | 2.1 per 1,000 people (aged 16+) | One of the lowest rates recorded since the Family Law Act 1975. |
| Estimated Lifetime Percentage | ~30% | The most commonly cited estimate for the lifetime probability of a marriage ending in divorce. |
| Median Duration of Marriage | 13.2 years | This is the time from marriage registration to the date the divorce was granted. |
| Median Age at Divorce (Male) | 47.1 years | Reflects the general trend of marrying and divorcing later in life. |
| Median Age at Divorce (Female) | 44.1 years | |
| Divorces Involving Children | Around 50% | Approximately half of all divorces granted involve children under 18 years of age. |
| Median Time from Separation to Divorce | ~3 to 4 years | The median duration from marriage to separation is shorter (around 8.4 years). |
What Is the Average Length of Marriage Before Divorce in the Australia?
The Australian Bureau of Statistics tracks how long marriages last before ending in divorce, and the most recent data shows that couples are hanging on longer than they used to. The current median duration from wedding to divorce is 13.2 years – proof that most marriages don’t collapse overnight, even if they occasionally feel like they might.
To understand that number, you have to separate two timelines: when couples split up and when the court finally stamps the divorce decree. On average, Australian couples separate after about 8.4 to 8.9 years of marriage. In other words, the relationship usually ends long before the paperwork catches up.
From separation to the final divorce, expect another 3 to 4 years of waiting. Blame the mandatory 12-month separation rule, the legal steps, and the court’s famously leisurely pace. So yes – most marriages last over a decade, but the administrative breakup drags on just long enough to make sure nobody’s rushing into anything… anymore.
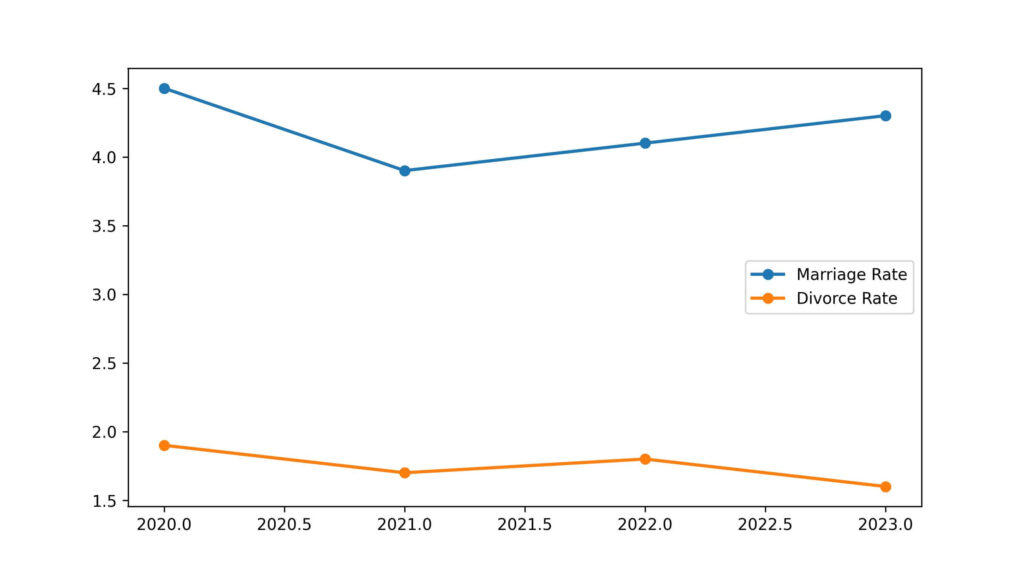
Are Divorce Rates Falling in the Australia? (2022–2025)
Yes, divorce rates in Australia have been sliding downward from 2022 to 2025, reaching some of the lowest levels seen in decades. The crude divorce rate has dropped from 2.4 in 2022 to 2.1 in 2024 – numbers not seen since the 1970s. So if you’re looking for dramatic spikes or moral panic, sorry, the data just isn’t cooperating.
The number of divorces, however, has bounced around a bit thanks to the aftershocks of COVID-19. Court delays, backlogs, and pandemic-forced relationship “quality time” all played a role. After the 2021 spike – more administrative cleanup than relationship chaos – the numbers have simply returned to normal.
Several factors are nudging the rate downward. Australians are marrying later, and later marriages tend to stick better. Most couples now live together before marrying, which works as a built-in compatibility test – breakups happen earlier, and the less-stable couples never make it to the altar (or the divorce stats).
And yes, “grey divorce” is rising, but not enough to offset the drop among younger couples. Add in the growing trend toward long-term de facto relationships – breakups that conveniently never show up in official divorce numbers – and you get a divorce rate that looks impressively low, even if real-life relationship drama hasn’t gone anywhere.
Divorce Statistics for Men vs Women
| Metric | Men | Women | Implication |
|---|---|---|---|
| Median Age at Divorce | 47.1 years | 44.1 years | Men are typically three years older than women when their marriage ends in divorce. |
| Median Age at First Marriage | 32.8 years | 31.2 years | This age gap at marriage is carried through to the time of divorce. |
| Peak Divorce Age Group (Proportion) | 45–49 years | 40–44 years | The highest concentration of divorce applications is slightly earlier for women than for men. |
| Divorce Rate Trend | Declining for younger age groups, increasing for 60+ | Declining for younger age groups, increasing for 60+ | The "Grey Divorce" phenomenon (divorce later in life) is a notable shared trend. |
| Divorce Rate (Age-Specific) | Generally lower than women’s rate in younger age brackets. | Generally higher than men’s rate in younger age brackets. | Women tend to have a higher age-specific divorce rate up to around age 45. |
Factors Influencing Divorce Rate in Australia
- Marrying Later. Australians now typically marry in their 30s, and later marriages tend to be more stable. More maturity + more financial stability = fewer early divorces.
- Pre-Marital Cohabitation. Most couples live together before tying the knot, which works as a real-life compatibility test. Many unstable relationships end before they ever count as “divorces.” Apparently, living together first is like quality control for love – catching the “oops” before the legal paperwork.
- Rise of De Facto Relationships. A huge share of long-term relationships never become marriages at all.When these relationships end, they don’t show up in divorce statistics – convenient for keeping the divorce rate looking low. Who needs official stats when you can just quietly split without bothering the government? Genius.
- Growing Financial Independence. Women’s increased education and workforce participation make it easier to leave bad marriages, making the divorce rate reflect reality rather than economic necessity.
- “Grey Divorce” Growth. Divorce is rising among couples in their 50s and 60s – often after kids leave home – but the increase is small compared to the overall decline among younger couples. Turns out, even decades-long marriages eventually hit the “meh, time for separate lives” stage.